YOUR HAY TEST RESULTS
You sent in a hay sample for analysis…great! This is an important first step to help you make the best choices for your horse’s feeding program. Now you have this report with lots of numbers…what does it mean? In this article we’ll look at a report and decipher the results.
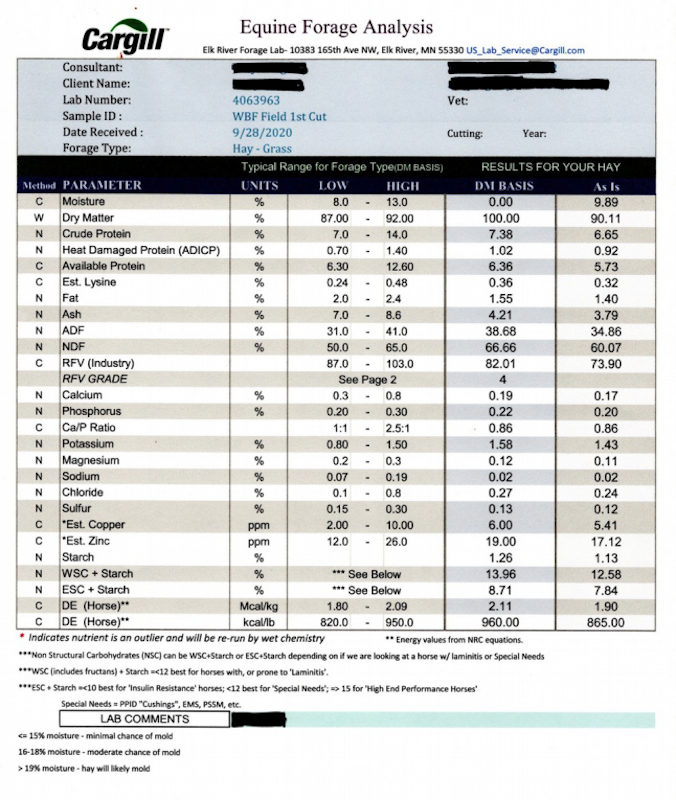
Here is a copy of a typical forage analysis, done by the Elk River Forage Lab in Elk River, MN. If you use a different lab, your results will probably have the same categories but may have a different appearance. This report is for a first cut, mixed grass hay produced in southern Maine in June. The hay sample was pulled and tested in September. Hay was taken from several bales from the same field.
Starting on the left, we see a column labeled “Method”. This tells you how the final numbers were achieved. N means a form of spectroscopy was used to determine the nutrients and characteristics. Wet chemistry (W) refers to testing the sample in liquid phase (think back to high school chemistry lab) and C means that the result is based on a calculation. Next, we see a column that tells us what the test was for, followed by the unit of measure. The middle of the page shows two columns labeled LOW and HIGH, and they show the range that is typical for hay produced in your region. The last two columns show the results for your hay on a dry matter (DM) basis and as the hay actually is. Dry matter results show what is left after the moisture is removed. It is especially useful when you are comparing several results because it reduces all the hay samples to a common level. If you are comparing two or more results, make sure that you are looking at the DM results for each and are not comparing an “As Is” sample with a DM sample. It’s important to note here that the report tells you what your hay has. It does not tell you what your horse needs.
In this article, we’re going to focus on the last two columns. Although it is helpful at times to look at the middle columns and see where your hay falls within that range, ultimately a hay analysis is about what you are feeding to your horse.
Let’s take a quick tour through the rows now.
MOISTURE is straightforward; it is the amount of moisture in your sample. You might think that drier is better, but hay that is too dry (under 10%) tends to be brittle and can easily shatter and become dusty. Horses may not like it. Hay that has too much moisture (over 18%) will likely develop mold over time. If this happens, this hay should not be fed to your horses. You could find yourself throwing out a lot of expensive product! How quickly mold develops depends on several factors such as heat, ventilation, where you store it, and how densely the hay is packed. DRY MATTER is simply the flip side of the moisture results.
CRUDE PROTEIN measures the protein concentration of your hay and varies depending on the type of grass and when it was cut. Grass hays tend to have lower protein levels, while legume hays, such as alfalfa, are higher. Hay that is cut sooner in the season rather than later tends to have a higher protein content. Unfortunately, thanks to Mother Nature, this is not something that humans can control! Most horses’ protein requirements can be met with hay that measures 10%, but if you are trying to improve your horse’s topline and build muscle, you may wish to add more protein to his diet. However, protein can be HEAT DAMAGED through microbial activity, so the actual available protein is the number you would look at in this sample. This sample obviously is low in protein!
Protein is made up of amino acids, and one of these is LYSINE. This is an essential amino acid, meaning that the horse cannot make it himself, so it must be supplied in his diet. While there is still much research being done on horses’ diets, it appears that lysine is the leader of the limiting essential amino acids. This means that for the protein chains to form and do their job, a certain amount of lysine must be present. If there isn’t enough present, then the other essential amino acids can’t do their jobs. Think of it in terms of your bridle: it doesn’t matter what kind- or how many- nosebands or reins you have if you are missing a cheekpiece.
FAT is not found in abundance in forage. Forage is mostly carbohydrates. If you need to put weight on your horse and the fat content of your hay is low, he will need a more calories in a concentrated form, such as grain or a fat supplement.
MINERALS: Ash seems like a strange thing to have in a forage report. It is a measure of minerals, such as calcium and phosphorus, and it also includes the dirt that ends up in your hay. Dirt can attach to hay in many ways. Perhaps it gets splashed onto the grass stalks during a heavy rain, or it can get stirred up during a drought when the hay is cut and tedded. This number tells you the overall percentage of minerals and dirt in your hay. It may not seem like a big deal, but in this example, for every 100 pounds that a horse eats, roughly four pounds are dirt and minerals.
The minerals in this report (calcium, phosphorus, potassium, magnesium sodium, chloride, sulfur, copper, and zinc) make up only a tiny portion of a horse’s diet but are critical for everyday life. Minerals are important for bone structure, teeth, helping to move oxygen through the body, maintaining the proper blood chemistry, aiding in digestion, and so much more than we can possibly cover here. The amounts and the proportions of minerals are important.
Of interest here is the calcium to phosphorus ratio (Ca/P Ratio.) The two minerals work together but are optimal only if the ratio is correct. We would like to see at least a 1:1 ratio, with the amount of calcium equal to the amount of phosphorus. More calcium than phosphorus is also ok, as long as there is enough phosphorus present, and some diets have a ratio of 2:1, with twice as much calcium as phosphorus. That is not the case here, where the ratio is 0.86:1. There is less calcium than phosphorus. Here is where things get tricky: if there is too much phosphorus, or more phosphorus than calcium, the excess binds to the calcium and makes it less available to the horse. Signs of deficiency, such as loose teeth, fragile bones, and weight loss can happen if this is not corrected. Luckily, the reverse is not true- if there is sufficient phosphorus, horses can tolerate excess calcium- even up to four times the recommended amount. Most hays, especially legumes such as alfalfa, have a good amount of calcium. (The horses eating this hay are on a ration balancer and senior feed with at least twice as much calcium than phosphorus to counteract this deficiency.)
Let’s move back up the page to ADF (Acid Detergent Fiber) and NDF (Neutral Detergent Fiber). These are measurements of the fiber in your hay. ADF measures cellulose, lignin, and other poorly digested components. A low number, such as between 30 and 35, are what we like to see, as they correlate with increased digestibility. If your hay is over 45, there is little nutritional value in it. NDF measures the insoluble fiber, and lower numbers (between 40 and 50) are typical of what the horse prefers to consume. Values over 65 are unlikely to be eaten by horses and if they are, increase the risk of impaction colic.
RFV, or Relative Feed Value, is an overall score of your hay based on digestibility, calories, and quality. It’s a useful tool to give you a quick overview of your hay relative to the needs of your horse. Hay with a value of less than 74 is considered very mature and probably won’t sustain a horse. Values between 75-86 are generally good for easy keepers and special needs horse, while 87-102 is ideal for horses doing light work and 103-124 is for horses doing moderate work. Values over 125 are ideal for heavy workers, lactating mares, and weanlings.
Now we’ll drop down to STARCH, WSC (water soluble carbohydrates) and ESC (ethyl soluble carbohydrates.) W and E refer to the testing methods, as some sugars dissolve in water and others in alcohol. We are usually concerned with NSCs or non-structural carbs. This number shows the amount of sugars and starches in the hay, and it can be either WSC + starch or ESC + starch. Generally, if you are concerned about laminitis, you would look for a WSC + starch value of less than 12. For most metabolic issues, such as insulin resistance, you would look for an ESC + starch value of less than 12.
DE or Digestible Energy can be thought of as calories, and the big question is…how many calories are in my hay? A 1000-lb horse that is idle needs roughly 16,000 Kcal per day. If your hay comes in at 865 kcal per pound, as this hay does, then he will need about 18 and a half pounds. It’s not quite two percent of his body weight, which would be 20 pounds, but the hay has a good calorie count so you could feed a little less and add a ration balancer to correct the protein and mineral deficiencies. We will talk more about ration balancers in another month.
We’ve covered a lot of information and it may seem overwhelming. This helpful chart from Penn State Extension sums up the major categories and the typical values. Please note that it does not tell you what your horse needs though.
DM Dry matter (forage minus water) ~85%
Moisture How wet the hay is 11-16%
NSC Non-structural carbohydrates (simple sugars/starch). Various measurements include WSC, ESC, and NFC. 5-25+%
NDF Neutral detergent fiber (hemicellulose + cellulose + lignin) 40-65%
ADF Acid detergent fiber (cellulose + lignin) 30-45%
CP Crude protein 8-20%
DE Digestible Energy 750-1000 Kcal/lb
Your results may have a helpful graph specific to your sample as well as other information, as shown in the second image. If you look at the graph, the RFV grade, and the sugars and starches, you will have a great overview of your hay.